 Figure 1.
The range of colors seen in stars is shown here in this group of stars
with a range of brightnesses as well as colors. Image courtesy of Don
Figer (Space Telescope Science Institute) and NASA.
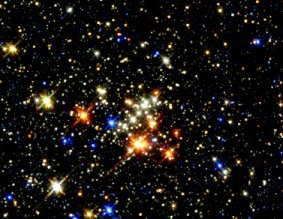
Figure 1.
The range of colors seen in stars is shown here in this group of stars
with a range of brightnesses as well as colors. Image courtesy of Don
Figer (Space Telescope Science Institute) and NASA. One of the most obvious differences is that they have different brightnesses. Some people equate this difference with size, but that isn't necessarily correct as you'll see. Why do stars have different brightnesses? There are actually two things that can influence how bright a star appears to your eye, the star's actual brightness and its distance from you. By actual brightness, I mean how much power a star has - you can think of it as wattage - just like light bulbs. Some stars have a higher wattage than others. Various combinations of actual brightness and distance give you the range of observed brightness that is seen in the night sky. Of course, if you were to just look at any star and see that it was brighter than the stars around it, the exact cause of the difference in brightness isn't obvious - is it a nearby star? Is it a really bright star? How can you figure that out?
The other difference that you can see amongst stars is that they can have different colors. Not everyone can see the color differences that well, but there are many stars that have very obvious color differences - some look rather reddish, some look yellowish, some look white-blue. Why do stars have different colors? The color difference is due to a basic characteristic of a star, the temperature of the star's surface.
Figure 1.
The range of colors seen in stars is shown here in this group of stars
with a range of brightnesses as well as colors. Image courtesy of Don
Figer (Space Telescope Science Institute) and NASA.
Now remember, we can't touch stars or sample them directly. Everything we learn about them is by looking at the light that comes from them and by applying certain laws of physics. By observing the features that we can, such as the colors, brightnesses, and spectra, it is possible to derive information on the masses, radii, motions, distances, temperatures and chemical compositions of stars. However, as you will see it is not always possible to find out everything about a star; sometimes very little can be discerned.
Astronomers assigned these numbers to a bunch of stars and eventually got the system worked into a standardized format, so that everyone was using the same numbers for the same stars. The scale was also calibrated a bit better but this resulted in some stars being assigned negative magnitudes. Actually, this magnitude system is pretty flexible. You can assign a magnitude value to not only stars, but also other things in the sky, including planets, comets, asteroids, galaxies, the Moon and of course the Sun.
The dimmest magnitude that you can see with your eye is about 6th magnitude. Big telescopes can see objects as faint as maybe around 20th magnitude. The Hubble Space telescope can see down to a magnitude of about 25 or fainter. What does that mean? Is a star with a magnitude of 4 really "weaker" or not giving off as much light as one with a magnitude of 2? No, this scale is just based upon how it looks to our eyes.The ancient astronomers defined magnitude as just a measure of how bright a star appears to us in the sky, so the value of the magnitude depends on both how close the star is and how much energy it is emitting. Obviously the Sun is at the top of the list of all objects in the sky in terms of brightness - it has the most negative value for a magnitude based upon how they appear in the sky. Here are some typical values for magnitudes -
| Star | Apparent Magnitude (m) |
| Sun | -26.8 |
| Arcturus | -.06 |
| Sirius | -1.47 |
| Vega | 0.04 |
| Betelgeuse | 0.41 |
| Polaris | 2.0 |
These magnitudes are referred to as the object's Apparent Magnitude (and that's what the m stands for). Again, it should be remembered that this is how we rank the brightness of the object as it is viewed from the Earth - it isn't really meaningful if we want to determine which star is really giving off the most energy.
To see how bright a star really is (how much energy it is giving off), it is necessary to remove the distance differences between stars. Unfortunately, this is not an easy task. Actually, it is easy, but we can't do it very well - but it really isn't our fault! Let me explain how you can find the distance to a star.
The easiest method to use to get a star's distance is to measure a star's parallax. No, that is not what you call two laxatives. What is parallax? If you remember the history of astronomy stuff, parallax is the shifting location of nearby objects compared to more distance objects when you change your viewpoint. If you still don't remember, then you can see how parallax works by taking your thumb and holding it at arm's length. Line it up with an object in the distance and view it with one eye. Now switch your eyes (I don't mean take your eyes out of your head and switch them, I mean close one eye and open the other - sheesh!). What did you see? Did it look like your thumb moved? Didn't you hold your thumb steady? If you held your hand steady, your thumb didn't really shift - but your perspective shifted; you viewed your thumb from a different location. If your eyes were further apart, guess what would happen? First, your head would probably hurt really badly, but as for what you would see, it would make the shift even larger. You can get a bigger shift if you can view the nearby object from very widely spaced viewpoints. However, there isn't really much that you can do to get your eyes further apart - at least nothing that I would recommend doing.
What would happen if you were to bring your thumb closer? What happens to the shift? You may notice that the amount of the shift has changed. The shift should get larger as you decrease the distance to your thumb. If you were to increase the distance between your eyes and your thumb, though that might be rather painful, you would get - yup, you guessed it, an even smaller shift. Now you can see how the size of the shift is related to the distance of your thumb from your eyes.
 Figure
2. Stellar parallax. As the Earth goes around the Sun, the position
of the nearby star appears to change relative to the more distant
background stars. The size of the shift is related to the distance of
the star.
Figure
2. Stellar parallax. As the Earth goes around the Sun, the position
of the nearby star appears to change relative to the more distant
background stars. The size of the shift is related to the distance of
the star.
The same thing can be done with stars. For the best results you want to use the most widely spread apart viewpoints possible. The biggest scale that we have available to us is the orbit of the Earth. Basically, you observe a nearby star at two times during the year, like in January and July. (See Figure 2.) When you compare the location of the nearby star relative to the distant, background stars, you may note that the position of the nearby star has shifted slightly relative to the background stars. The parallax shift of stars can be related to the shift you saw with your thumb. In this case, the two locations of the Earth correspond to your eyes (your two different views) and the nearby star corresponds to your thumb. The parallax concept was known even to ancient people, and it was one of the reasons they gave for the Earth to be in the center of the solar system and to be stationary. They thought that if the Earth did have an orbit, then they could see the parallax shifts of stars. They didn't. This is because parallax angles are very, very, very small and can not be seen without a pretty good sized telescope. Take a peak at Figure 3 to see the situation.
 Figure 3. The
size of the parallax shift is related directly to the distance of the
object. The parallax angle for the nearer object, p1, is larger than the
shift for the more distant object.
Figure 3. The
size of the parallax shift is related directly to the distance of the
object. The parallax angle for the nearer object, p1, is larger than the
shift for the more distant object.
The size of the shift is denoted by p. It would be ridiculous to measure its size of p with degrees or arc minutes, since p is usually so small. Instead it is always measured in arc seconds (remember one arc second is 1/3600 of a degree, a very small angle indeed). We know that the size of the parallax shift is related to the distance of the star, so you can use the following relation
d = 1/p
to find the distance to the star. d (distance) will be in
units of Parsecs, and p is of course in arc seconds (small
fractions of a degree, whose symbol is "). In case you are
wondering, a parsec is just a regular unit of measure that was based
upon the parallax concept - get it? For those of you who are fans
of science fiction, 1 parsec (abbreviated as pc) = 3.26 light-years,
and yes, light-years are also legal units of measurement, just like
kilometers, inches and miles. Don't get confused by the name, a
light-year is a unit of distance, not time. A parsec is actually a
fairly large distance, about 3.09 x 10¹³ km, which translates
to about 20 trillion miles. A light-year is a mere 5.9 trillion miles.
Astronomers use parsecs and light-years pretty interchangeably.
Distances to stars are usually measured in the tens or hundreds or
thousands of parsecs or light-years. When we get to galaxies we'll be
using millions and billions of parsecs and light-years - but we have a
long ways to go before we get there.
The closest star (apart from the Sun) would have the largest parallax angle. This star is alpha or Proxima Centauri, which has a p=3/4", giving it a distance of
d=1/(3/4) = 4/3 pc
If a star has a parallax angle of 0.01", then it has a distance of
d = 1/0.01=100 pc.
Remember, the angle gets smaller as the distance gets larger. The largest angle we can measure for a star (that for Proxima Centauri) is so puny that it isn't even the size of 1". All other stars have even smaller angles (are at greater distances). 3/4" is not very big; it is about how wide a pencil lead would look if you were to stand 1.5 football field lengths away from it. That's pretty small. It is possible to measure the parallax angle for only about 10,000 stars using even the best telescopes on Earth. You might remember that the Earth's atmosphere has this annoying tendency to smear out the light in the atmosphere, making it hard to get precise position measurements.
To help get past the problem of the atmosphere, a special satellite, named Hipparcos, was launched with one main task, to measure the parallax shifts of over a million stars. It finished its job in the late 1990s and these improved distances have really helped astronomers figure out distances to other stars. The Hipparcos satellite was able to measure very precise parallax angles, in some cases down to 0.001" accuracy. A new satellite, Gaia, was launched in 2013 to measure the positions of a billion stars. This will hopefully construct a 3-D map of our neighborhood, and provide even better distance measurements/parallax angles. The results have yet to be released, but Gaia is expected to complete its mission in 2018.
While the parallax method is the most direct method of measuring the distance to a star, there are other methods which depend upon various special circumstances or characteristics. We'll look at some of these later.
What has all of this distance determination gotten us? Remember, we were trying to figure out how to find out which stars are really the brightest. Once the distance to a star is known, it is possible to compensate for the distance and we can figure out what the actual brightnesses of stars are. The best way to do this is to move all stars (not actually move them, but account for their distances in some mathematical ways) to the same distance and then compare their brightnesses. This is like having a group of people all stand in a line so that you can tell which ones are taller or shorter. If we were to move all stars to a distance of 10 pc from the Earth and then measure their brightnesses, we could determine which stars were actually brighter and which ones were actually fainter. The magnitude that a star would have if it were placed 10 pc from the Earth is known as the Absolute Magnitude. To distinguish it from apparent magnitude, we use M.
Here are some stars' apparent and absolute magnitudes. Of course, the Sun is a lot closer than the other stars, so its apparent magnitude is quite a bit different from its absolute magnitude. In the cases of the other stars, some have to be brought in closer, since they are further than 10 pc away, while some stars have to be moved away since they are closer than 10 parsecs. Which stars in the list below had to be moved closer and which had to be moved further away?
| Star | Apparent Magnitude (m) | Absolute Magnitude (M) |
| Sun | -26.8 | 4.83 |
| Sirius | -1.47 | 1.4 |
| Arcturus | -.06 | -0.3 |
| Betelgeuse | 0.41 | -5.6 |
| Polaris | 2.0 | -4.6 |
| Vega | 0.04 | 0.5 |
The stars that had to be moved away from the Earth to place them at 10 pc are the Sun, Sirius and Vega. You know this because their absolute magnitudes have a larger numeric value than their apparent magnitudes - the stars became fainter. The other three stars had to be brought in closer, so their absolute magnitudes have smaller values than their apparent magnitude values. Remember, the apparent magnitude and the absolute magnitude scale is sort of backwards - the larger the number, the fainter the star. Unlike the apparent magnitude, the absolute magnitude of a star is a realistic measurement of its energy output. By comparing absolute magnitudes, you are comparing the energy output differences between stars. Which star in the list is producing the most energy? Is it the Sun? No - that's actually the weakest star (it has the largest absolute magnitude value). Betelgeuse is the most powerful (highest energy producing) star in this list since it has the most negative value for its absolute magnitude.
The formula which relates the magnitudes and distances is a fairly
straight forward formula, which is
m-M = -5 + 5 log(d),
where the m and M values are the magnitudes, and d is the distance in parsecs.
This is a pretty handy formula for converting things. Some people get a
bit confused since the distance gets to go through the log
function - don't worry about that - it's a pretty simple function on
most calculators. To un-log something, you just take it to the
power of 10. If you have a star with an apparent magnitude of 7 and an
absolute magnitude of -2, how far away is it? Just put the numbers into
the formula
7- (-2) = -5 + 5 log(d)
9 = -5 +5 log(d)
9+5=5 log(d)
14/5 = log (d)
2.8 = log (d), so d=102.8=630 parsecs. That wasn't so bad,
was it?
That is one thing we can learn about stars - absolute magnitudes can tell us which stars are producing more energy. What does this energy output depend on?
Let's go back to the rules for black bodies. Remember, these are the hot, solid objects that produce continuous spectra. Now stars aren't really black bodies, but they are pretty close, or at least close enough so we can use the rules for black bodies to make our lives easier. One of these rules was how much energy a black body produces - the Stefan-Boltzmann law -
E = T4
T4
where is a constant and the energy emitted is
the number of Watts per square meter given off by the black body. The
energy output from this formula is given in terms of the energy per
unit surface area, so the size of the black body (or star) would
influence the over all energy output. A larger star (one with a large
surface) would produce more energy. To account for that we use the
following formula:
Luminosity = L = 4 R2 T 4
where (=3.14 or so) and are
constants, T is the temperature of the star's surface, and R is the
radius of the star. This defines the luminosity, the way that we
talk about the energy outputs or brightnesses of stars. Unlike the
magnitude system, the larger the number for the luminosity, the
brighter the object is. Luminosity is measured in units of Watts, just
like light bulbs, and it is one of the more important characteristics
for stars that astronomers like to determine; I guess we're just silly
that way. There are ways to translate absolute magnitudes into
luminosity values, so at times you may see either one of these scales
used in comparisons of stellar brightness. Either way you look at it, a
star's brightness may be given in terms of its luminosity or absolute
magnitude.
To make things simpler, astronomers often talk about the luminosity or temperature or radius of a star in terms of the Sun - if you do that, then you can use a simplified version of the above formula.
L = R2 T4
If a star has a temperature that is two times that of the Sun's, then it's luminosity would be 2x2x2x2=16 times greater. If a star has a temperature that is two times greater than the Sun and it is 1/3 the radius of the Sun, then its luminosity would be (1/3)2 24 = 16/9 = 1.78 that of the Sun. This is much easier to do than dealing with all of the messy symbols that are in the original formula. Once you have the value of luminosity and temperature for a star, this formula can be used to determine the radius, or if you have the radius and temperature you can get the luminosity, or.... I think you get it, if you have two of the three things in the formula you can figure out the missing value.
The luminosity depends upon the temperature of a star, so it
would be a good idea to be see how astronomers are able to determine a star's
temperature. One way to determine
the temperature is to use Wien's Law (![]() max = 0.0029/T) to
determine the temperature of a star, provided you can actually observe
max = 0.0029/T) to
determine the temperature of a star, provided you can actually observe ![]() max
- the wavelength at which most of the light is emitted. This is not
possible for the hottest or the coolest objects, since they would
produce most of their light at wavelengths beyond the visible part of
the spectrum, and unless you have access to a special telescope, you're
out of luck. You would need other types of telescopes to study them,
such as X-ray, UV, IR or radio. However, most stars do have their peaks
in the visible part of the spectrum, so we can determine the
temperatures of most stars by using Wien's law.
max
- the wavelength at which most of the light is emitted. This is not
possible for the hottest or the coolest objects, since they would
produce most of their light at wavelengths beyond the visible part of
the spectrum, and unless you have access to a special telescope, you're
out of luck. You would need other types of telescopes to study them,
such as X-ray, UV, IR or radio. However, most stars do have their peaks
in the visible part of the spectrum, so we can determine the
temperatures of most stars by using Wien's law.
Another method, that is a bit easier than Wien's law is known as photometry. While this sounds like a complicated method, it is really quite simple. Remember how we went over the differences of stars, how their colors are different because their temperatures are different? What if you could measure the color of the star? That is sort of what photometry is. Astronomers use special filters on their telescopes to note how the brightness of the star changes when viewed with different color filters. A really cool star would be very bright when viewed through a red filter but not very bright when viewed through a green filter. A hotter star would have more light coming through the green filter, and an even hotter star would be giving off more light in a blue filter compared to a red filter. By measuring the relative differences of the light observed through the various filters (by measuring their magnitudes), astronomers can assign a temperature value to the star. This is the most common method of determining a star's temperature.
What have we been able to figure out so far? - the distances, the luminosities and the temperatures of stars. What else can we learn about stars? How about a star's spectra? To see what can be learned from a star's spectrum we'll learn about a rather nifty bit of stellar research history. Early in the 20th century, astronomers at the Harvard College Observatory started to catalog various spectra. How do you catalog spectra? First you need to obtain spectra, which is pretty easy and was done using photographic techniques and a prism-like device (spectroscope) to spread out star light into spectra. Stars are so far away, and even with the biggest telescope they look like dots, so their spectra end up being really tiny - so tiny, in fact, that you have to view them with a microscope. Nowadays with computers this eye-strain is avoided, but in 1910 this was the way it was done. Who was going to spend hours peering into a microscope at tiny little spectral features? The astronomers weren't going to do it since they had more important things to do. The students weren't going to do it; after all, they were paying to go to college. The folks at Harvard needed some workers who would be willing to work for pretty low wages, do very meticulous work and work with very delicate objects (since the spectra and other astronomical pictures were often produced on glass plates). Obviously, the best pool of laborers would be women. Those women worked like the dickens! There was one lady, Annie Jump Cannon who classified more than 250,000 stars herself.
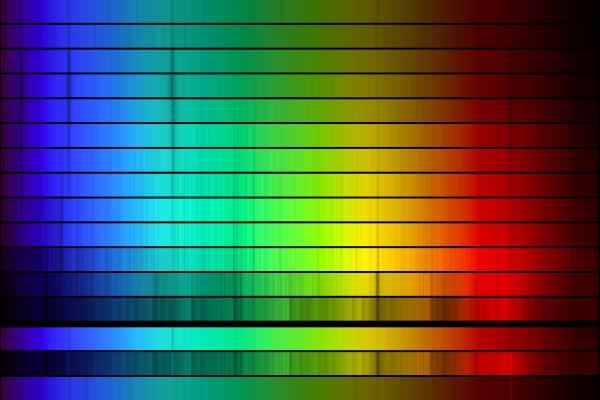 Figure
4. Typical stellar spectra - note that these are all absorption
spectra. Also notice that the pattern of the spectral features are
different from one star to another. You can click on the image to see a
larger version of it. Image courtesy of NOAO/AURA/NSF.
Figure
4. Typical stellar spectra - note that these are all absorption
spectra. Also notice that the pattern of the spectral features are
different from one star to another. You can click on the image to see a
larger version of it. Image courtesy of NOAO/AURA/NSF.
You've got a bunch of spectra to classify; how do you go about doing that? The obvious thing is to look for trends in the spectra. One trend was that the strength of the spectral features associated with hydrogen appeared to be very prominent in some stars and not so prominent in other stars. Hydrogen is a pretty important element, so let's call those stars with really prominent hydrogen spectral features 'A' type stars. Those with slightly weaker hydrogen spectral lines are 'B' type stars. Then you could also classify stars that have other elements with other letters of the alphabet. 'C', 'D', and a whole alphabet soup of star types (spectral types) seemed to pop up.
After awhile, they determined that the classification system was not an accurate portrayal of the physical characteristics of the stars. 'A' type stars didn't really have more hydrogen than other types of stars, but the conditions in their atmospheres made it a very strong feature in their spectra. At the time astronomers thought that the stars were made of the same stuff as the Earth was - lots of rock and such. Someone wrote up their Doctoral thesis and proposed that stars were actually made up mainly of hydrogen and helium. This was Cecilia Payne, the first person to ever get a Ph.D. from Harvard observatory. At the time, most astronomers didn't think she was correct, but eventually it was shown that she was correct about the nature of stars. Stars are made up of pretty much the same stuff (mainly hydrogen and helium), so the variation in the spectra has to be due to something else. It was determined that the primary cause of the variations in the spectra is the temperature of the star's surface. Now the astronomers had a bunch of stars classified by an alphabetical system that wasn't really in a logical or useful order. It would be better to arrange the stars in order of temperature, since that is what makes the various spectra unique. They had already labeled most of the stars, and didn't want to relabel them, so they just rearranged the sequence of star types into an order based upon temperature. There were also some redundant star types that needed to be removed and eventually the way that the spectral classification were ordered was put into a logical format.
Once everything was rearranged, the spectral classification system was defined. The order of the letters that are used to classify different stars were initially arranged as follows - OBAFGKM (ordered from high to low temperature). There is also an old alternative sequence that uses some rather obscure spectral types, and this is OBAFGKMRNS. Again, the stars are arranged from hottest to coolest surface temperature (though R, N and S types are sort of the same as K and M types). These orders of letters are not the easiest things to remember, so a memory aid would be good to have for these things. It was the male astronomers (probably very lonely male astronomers) who devised a way to remember the order of the stars by using the little saying Oh Be A Fine Girl, Kiss Me. Of course, now you can say Oh Be A Fine Guy, Kiss Me or, with the longer saying, Oh Be A Fine Girl/Guy Kiss Me Right Now Sweetie. Figure 5 shows various spectra with their types labeled.
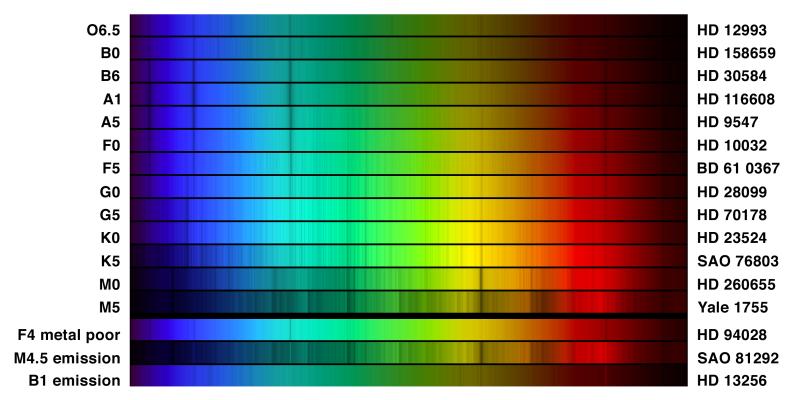 Figure 5. Typical examples of the different spectral
types. The hottest stars, O-types, are near the top, while the coolest,
M-types, are at the bottom. There are also some unusual stars included.
The names of the stars are indicated on the right - most are just their
catalog designations. Note how the spectral line patterns change with
changing temperature. Click on the image to see a larger version.
Image courtesy of NOAO/AURA/NSF.
Figure 5. Typical examples of the different spectral
types. The hottest stars, O-types, are near the top, while the coolest,
M-types, are at the bottom. There are also some unusual stars included.
The names of the stars are indicated on the right - most are just their
catalog designations. Note how the spectral line patterns change with
changing temperature. Click on the image to see a larger version.
Image courtesy of NOAO/AURA/NSF.
While it is true that stars all have pretty much the same chemical make-up (mainly hydrogen and helium), there are some subtle differences in their compositions. Stellar spectra can help astronomers find these differences, usually by looking at things like the amount of iron or other heavy elements in the spectra. Generally, stars have a composition of about 97%-99.999% Hydrogen and Helium combined, with the remaining fraction comprised of all of the other elements. You might not think that this is a very diverse range in composition, but the fact that the metal content (non-hydrogen and helium part) ranges in value from 3% to 0.001% does show that not all stars are made out of exactly the same stuff. As you'll see, there is a very good reason for this.
Once enough information about stellar temperatures (from photometry or spectral classification) and luminosity (from absolute magnitudes) was known, some people started to see relations between these quantities. Two fellows took the information on the stars' temperatures, often in the form of a spectral type or color, and the luminosities, often in the form of an absolute magnitude, and made up a diagram relating these two quantities. These two fellows did the same thing at the same time, quite independently, on different sides of the Atlantic Ocean, so the diagram is named after both of them - the Hertzsprung-Russell Diagram, or, more simply, the H-R Diagram. Figure 6 shows a typical H-R diagram. One thing that is confusing about the H-R diagram is that the temperature scale increases towards the left. This isn't normally how you would graph things, but since they often used the spectral classification system to set up the temperature scale, and that goes from hot to cool, you get a 'backwards' temperature scale. This is just another one of those annoying things that astronomers like to do to confuse poor undergraduates.
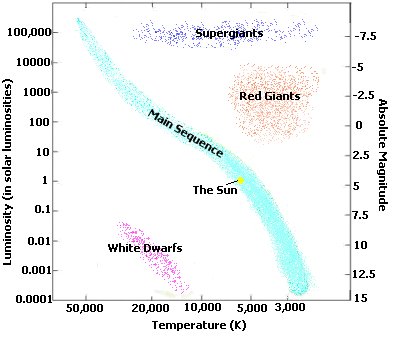 Figure 6 Typical H-R diagram. Notice
that the vertical axis can be scaled by either the luminosity or the
absolute magnitude values. Also note that the temperature scale
increases towards the left. The main types of stars are also included.
Figure 6 Typical H-R diagram. Notice
that the vertical axis can be scaled by either the luminosity or the
absolute magnitude values. Also note that the temperature scale
increases towards the left. The main types of stars are also included.
It was noticed that stars were not scattered randomly about the diagram but were found in various distinct groups. Each group has its own characteristics, and it is possible to use the Luminosity-Radius-Temperature relation to expand upon these characteristics.
Main Sequence (M.S.) Stars - The diagonal through the middle is big since most stars are of this type, about 90% of all stars, in fact. The Main Sequence stretches from the low luminosity, low temperature stars in the lower right to the high temperature, high luminosity stars in the upper left. A very wide range of characteristics are found amongst stars on the Main Sequence, as you'll see. This is also where you would find the Sun.
Giant Stars - These tend to be more luminous than stars on the Main Sequence and often have lower temperatures than stars of comparable luminosity on the Main Sequence. For them to have lower temperatures but not significantly lower luminosities they must have a really big radius. How big are they? They are big enough so they are called Giants! They are often at sort of low temperatures, so they are usually named Red Giants. In the old days, people sometimes referred to the stars on the Main Sequence as "dwarfs" since they were so much smaller in radius than the Giants. However, this is not a very common name anymore, though you may still see it pop up on occasion.
Supergiant Stars - These are just really big stars. They come in both hot and cool varieties - Blue and Red Supergiants - and they are just really, really luminous, so you find them hanging out in the upper part of the H-R diagram. They can also have pretty high radii values as well. They are just BIG!
White Dwarf Stars - These are stars found in the lower left corner of the graph. They are generally on the left side, so this means that they are pretty hot. They are also very faint. To get low luminosities with high temperatures, they must have very small radii. That's why they are called white dwarfs - hot and puny.
You may have noticed that stars can have the same spectral type (temperatures) but may have vastly different luminosities - often one star's luminosity is thousands of times greater or less than another with the same temperature. This difference in the luminosities does have a subtle influence on the spectra so that astronomers can use it to classify stars in another way (oh goodie, another classification scheme!). This classification is known as the Luminosity Class. The various classes are shown in Figure 7. Stars on the Main Sequence are type V, while various giants are types IV, III, and II, and Supergiants are type Ia or Ib. You can describe the Sun as being a G2V star. What about the White dwarfs? Generally they just get a "D" attached to their spectral type - like DA3. A combination of the spectral type and the luminosity classes allows you to determine where any star is on the H-R diagram.
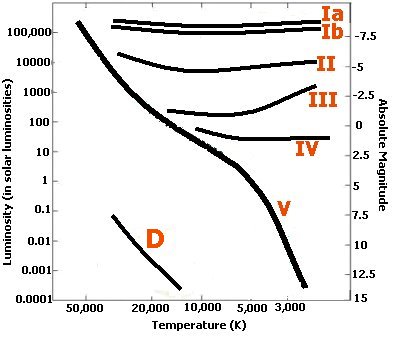 Figure 7. The various luminosity
classes are shown. Main Sequence stars are denoted with a V, those
slightly above the Main Sequence are IV, Giants are III, Bright giants
are II, and Supergiants are either Ia or Ib. White dwarfs are just
denoted with a "D".
Figure 7. The various luminosity
classes are shown. Main Sequence stars are denoted with a V, those
slightly above the Main Sequence are IV, Giants are III, Bright giants
are II, and Supergiants are either Ia or Ib. White dwarfs are just
denoted with a "D".
Once the H-R diagram was popularized, a new method of determining the distances to stars was found - that of spectroscopic parallax. Actually, this is a rather confusing term, since there is no parallax angle measured. What it should be called is spectroscopic distance, since it is done by taking the spectrum of a star and determining where the star belongs on the H-R diagram. The H-R diagram can be set up using absolute magnitude on the vertical axis; when you classify the star according to its spectral type and luminosity class you can read off the value of absolute magnitude. That can be compared to the apparent magnitude to get the distance. Let's say you have a star which you obtain the spectrum for. When you compare to other stars, you see that the star's spectrum is a K1 IV type star. A K1 star has a temperature of around 5000 K. Looking at Figure 7, such a star would have a corresponding absolute magnitude of around 1. This can be compared to the star's apparent magnitude and the distance can be determined.
Make sure you understand H-R diagrams pretty thoroughly, since you'll be seeing a lot of them for this part of the course. They are the main tools used to show how stars relate to one another and they help astronomers to map out groups of stars for comparison.
So far we have been able to determine distances, luminosities, temperatures and radii of stars. What about their masses? That is where binary star systems come into play. Most stars are in some sort of group, with the most common grouping being a binary system (two stars). Stars in a binary system are orbiting one another, so they must obey the rules that govern how objects orbit - Kepler's Laws! You thought those laws only applied to planets! Actually, you need to use special forms of Kepler's laws when you apply them to stars, but they are really just the same laws.
Remember, Kepler's law (the 3rd law specifically) has in it terms for the distance between the objects and the period of the orbit. Usually when astronomers view binary star systems they can determine how long it takes to orbit, while the distance between the stars is a little bit more difficult to figure out. Generally there are some estimates that can be made about the separation of the stars, and then these estimates are carried over to the masses, so that generally we only have a good estimate of the mass. We usually don't have incredibly precise values for the masses, just good estimates.
Kepler third law when applied to stars is actually still pretty
simple -
M1 + M2 = a3/P2
where M1 and M2 are the masses of the two stars (in
solar masses), and a is the
average distance apart (measured in A.U.) and P is the period of the orbit
(measured in years). If you wanted to use this law to determine the
masses of the individual stars, then this won't get it for you. This
will only get you the sum of the masses, not their individual masses.
You need another formula to get the masses. This formula is called the Center of Mass formula, or some such
silly thing, but I like to call it the see-saw formula. Here it is
M1 a1 = M2 a2
where a1 and a2 are the average distances each star
is from the center of the orbit (See Figure 8) and I should also mention
that a1 + a2 = a.
As with the modified version of Kepler's third law given above, the
masses are in solar masses and the distances are in A.U.s.
 Figure
8. Binary star system - the orbits of two stars is shown; both
go around the center of mass. The distance each is from the center of
mass changes as they orbit, so the average distance each is from the
center of mass is used in the formulas.
Figure
8. Binary star system - the orbits of two stars is shown; both
go around the center of mass. The distance each is from the center of
mass changes as they orbit, so the average distance each is from the
center of mass is used in the formulas.
What's the center of the mass? It may be easier to think of it as
the center of the orbit. Think about it - if you have one object
orbiting a fairly stationary object, it's pretty easy to figure out the
orbit size and where the center of the orbit is. In a binary star
system, both objects are moving - so how can you figure out the orbit
size if neither object is standing still? We have to define a location
for the center of the orbit. This location is known as the center of mass. Just think of a
binary system as a see-saw or teeter-totter. If you have two people on
a see-saw, and one weighs much more than the other, then how should the
people sit so that they balance? Have the big person sit closer to the
pivot point. Figure 9 shows the arrangement. This is just like what
happens in the binary star system. The bigger star is closer to the
pivot point - the center of the orbit (or center of mass). Actually, if
you look at the formula for the center of mass you can rearrange it so
that the masses are on one side of the formula and the distances are on
the other. In this case you would end up with
M1/M2 = a2/ a1
which is pretty nifty. If you have a mass that is five times greater
than another mass, then that mass has to be five times closer to the
center of mass (its a value has to be five times smaller). The
ratio of masses is inversely proportional to the ratio of distances.
Sometimes the big star is so close to the pivot point that the pivot is actually enclosed within the star. It looks like the big star doesn't move - it really does, but not enough to be obvious. This also applies to the Sun and the planets. The Sun actually does move a little bit, mainly due to the influence of Jupiter. Anyways, with the two formulas, it is possible to solve for the individual values of mass, though it will require some algebra.
 Figure 9. The center of mass depends upon the masses
of the object involved. The center of mass is closer to the object with
a larger mass. The way that the masses relate to one another is the
inverse of the way that the distances to the center of mass are related
to one another.
Figure 9. The center of mass depends upon the masses
of the object involved. The center of mass is closer to the object with
a larger mass. The way that the masses relate to one another is the
inverse of the way that the distances to the center of mass are related
to one another.
There are two main types of binary star systems. The first is the Optical Binary. This is not a "true" binary system. The stars just appear to be next to one another in the sky, but are in reality very far apart. If you have ever looked at the two stars in the handle of the Big Dipper, Alcor and Mizar, they look like they are close to one another. This is actually an optical binary system, since these stars are really very far apart from one another. They are just lined up in a way that makes it look like they are next to each other. This type of binary system is pretty useless for getting information about the masses since the stars are not in orbit about one another. The truly useful binary systems are the Physical Binary Systems. This is where you have two stars orbiting about one another so that you can apply the modified versions of Kepler's Laws, and they can be used to determine the masses of the stars. To make things just a little more complicated, there is more than one type of Physical Binary system (you knew it wouldn't be so easy, didn't you?).
 Figure 10. Optical Binary - the
stars are not anywhere near one another, but because of their alignment
in the sky appear to be close to one another.
Figure 10. Optical Binary - the
stars are not anywhere near one another, but because of their alignment
in the sky appear to be close to one another.
There are 3 types of Physical Binary Systems. The first is the most obvious - the case where you see two stars actually moving about one another. This is known as a Visual Binary. Actually, this is a fairly rare type of binary system, since you have to be able to see the motion and only very nearby stars will show motion in a binary system. You can see their orbits, so you can estimate the sizes of the orbits as well as the periods. Once you have done that you can apply Kepler's Third Law and the center of mass law to determine the masses of the two stars.
 Figure 11. A visual binary system is
shown. The stars are in orbit about the center of mass of the system.
The sizes of their orbits depend upon their masses - the more massive,
the closer to the center of mass.
Figure 11. A visual binary system is
shown. The stars are in orbit about the center of mass of the system.
The sizes of their orbits depend upon their masses - the more massive,
the closer to the center of mass.
Binary stars move and motion can often be detected in the spectrum of a star (via the Doppler effect), so the next type of Physical Binary system is the Spectroscopic Binary. In this case you may not actually see two stars, but the spectrum reveals the presence of two stars orbiting about one another. In this instance, you would see Doppler shifts due to orbital motions - one star moving towards you and the other moving away. Again, by following the motions you can derive the orbital periods and the sizes of the orbits, and using Kepler's laws you can get masses. It is also possible that one of the stars is so faint that you don't even see its spectral features, but you only see one set of spectral lines going from redshifted to blueshifted and back again as it orbits the other. Even with this little bit of data it is still possible to get some idea of the masses involved.
 Figure 12. A spectroscopic binary is shown. The
motion is seen in the spectrum by how it is affected by velocity. The
spectrum of the star coming towards us is blue shifted (seen at shorter
than normal wavelengths), while the spectrum of the star moving away
from us is red shifted (longer wavelengths). The stars switch direction
as they orbit about the center of mass, so the spectral features
associated with each star also switch from being red to blue shifted
and from being blue to red shifted. In reality you would see the two
spectra combined into one so the lines would go back and forth across
one another.
Figure 12. A spectroscopic binary is shown. The
motion is seen in the spectrum by how it is affected by velocity. The
spectrum of the star coming towards us is blue shifted (seen at shorter
than normal wavelengths), while the spectrum of the star moving away
from us is red shifted (longer wavelengths). The stars switch direction
as they orbit about the center of mass, so the spectral features
associated with each star also switch from being red to blue shifted
and from being blue to red shifted. In reality you would see the two
spectra combined into one so the lines would go back and forth across
one another.
The third type of Physical Binary system is the most useful. This is the Eclipsing Binary system. In this case you see a light variation as the stars pass in front of one another and/or behind one another. The overall brightness of the star system changes over time in a repeated, periodic manner. By following the change, you can determine the period of the orbit and the size of the orbit, and apply Kepler's laws to get the masses. This binary system has an added bonus! The duration of an eclipse will depend upon how wide the stars are, so it is possible to also determine the radii of the stars in these binary systems. This type of binary is particularly useful.
 Figure
13. An eclipsing binary
system. The variation of the brightness (the graph at the bottom) due
to eclipsing stars depends upon the brightness of the individual stars.
When the stars are both visible, the brightness is at a maximum value.
During the eclipses, the brightness goes down when something is being
covered up. The sizes of the stars (radii) can be seen in the widths of
the eclipses.
Figure
13. An eclipsing binary
system. The variation of the brightness (the graph at the bottom) due
to eclipsing stars depends upon the brightness of the individual stars.
When the stars are both visible, the brightness is at a maximum value.
During the eclipses, the brightness goes down when something is being
covered up. The sizes of the stars (radii) can be seen in the widths of
the eclipses.
With the masses obtained from binary star systems, it is possible to
compare the masses (M) and luminosities (L) of individual stars. When we
look at these characteristics for stars on the Main Sequence, we note
that there is a very good relationship between M and L. The relation is
pretty simple
L= M3.5
where the mass and luminosity are given in terms of the Sun. Remember,
this formula works well only for stars on the Main Sequence, and units
for mass and luminosity are in terms of the Sun - how many times the
star's mass or luminosity is greater or lesser than the Sun. Figure 14
shows this relation.
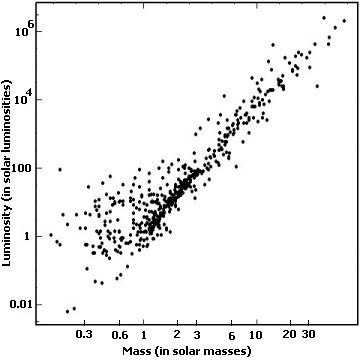 Figure 14. The masses and luminosities of 250 binary
stars are plotted up. The values for mass and luminosity are given in
terms of the Sun's mass and luminosity. Many of these stars are not
found on the Main Sequence, so there is a great deal of scatter in the
data points. A relatively straight line relation can be seen here,
which indicates that there is a simple relation between the masses and
luminosities, especially for Main Sequence Stars.
Figure 14. The masses and luminosities of 250 binary
stars are plotted up. The values for mass and luminosity are given in
terms of the Sun's mass and luminosity. Many of these stars are not
found on the Main Sequence, so there is a great deal of scatter in the
data points. A relatively straight line relation can be seen here,
which indicates that there is a simple relation between the masses and
luminosities, especially for Main Sequence Stars.
The Main Sequence is very well ordered in several respects - stars range from low temperature, luminosity and mass (those in the lower right corner) to stars of high temperature, luminosity and mass (upper left corner). Why is it like that? How do the other groups of stars fit into all this? Do stars ever change their characteristics? Do you really have to know all of this stuff? Yes, of course you do.
As more and more people started to classify stars according to their spectral types and luminosity classes, they noticed some interesting trends. When you look at the number of stars of the different spectral types out there, you may note that most are located at the low temperature end of the Main Sequence. These stars are faint, small, and red, so they tend to be referred to as red dwarfs. While these are not the brightest stars out there, they are the most common. K and M types easily outnumber the O and B types by a wide margin. It is likely that the L and T types actually outnumber all other types, but the problem with them is finding them - they are just so faint and are very difficult to detect so we don't have accurate statistics about them.