
Astronomical Symbol for the Sun
In this part of the course we'll be looking at stars, and to start things off, we'll look at the star that is near and dear to our hearts, the Sun. A lot of people forget that the Sun is actually a star. It is just so dang bright when compared to the stars that you can see with your eyes at night. The Sun isn't a really powerful star, or a very massive or hot star, it is just a very nearby star. It is right next door, so to speak, so we can use its proximity to learn a great deal about it and also other stars.
 |
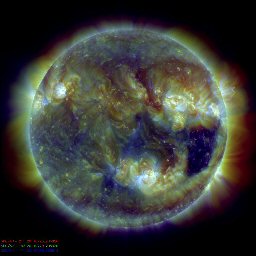 |
Figure 1. Images of the Sun. The one on the left is taken with a filter that allows images to be obtained of the surface features safely - without burning out the camera or the telescope. The image on the right is a false-color composite image taken with different wavelength sensitive cameras on the SDO spacecraft. Both images show the Sun, but not just the surface layer. Image courtesys of SOHO/MDI consortium. SOHO is a project of international cooperation between ESA and NASA, and NASA/SDO and the AIA, EVE, and HMI science teams. |
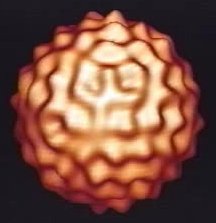
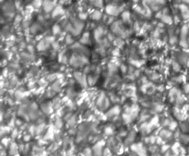 Figure 2.
Granules on the surface of the Sun. Each bubble is around 1000 km in
size. The differences in the shades is due to temperature differences,
with lighter areas being hotter. Image courtesy of NASA's Solar
Physics Research Site.
Figure 2.
Granules on the surface of the Sun. Each bubble is around 1000 km in
size. The differences in the shades is due to temperature differences,
with lighter areas being hotter. Image courtesy of NASA's Solar
Physics Research Site.
The photosphere is pretty much the "surface" of the Sun, so it is the layer from which the light that is produced inside the Sun is released. When we look at the light from the Sun we see that it produces an absorption spectrum. The Sun's surface is thick enough to look solid, so why doesn't it produce a continuous spectrum? Why are there absorption lines?
 Figure 3. The Sun's visible
light spectrum showing absorption lines. The entire spectrum extends
over a wide range of wavelengths, which are seen here as the different
spectral colors (remember ROY G. BIV?) and are chopped up so that it
doesn't stretch off too far. You can click on the image to see a larger
version. Image courtesy of Nigel Sharp, NOAO/NSO/Kitt Peak
FTS/AURA/NSF
Figure 3. The Sun's visible
light spectrum showing absorption lines. The entire spectrum extends
over a wide range of wavelengths, which are seen here as the different
spectral colors (remember ROY G. BIV?) and are chopped up so that it
doesn't stretch off too far. You can click on the image to see a larger
version. Image courtesy of Nigel Sharp, NOAO/NSO/Kitt Peak
FTS/AURA/NSF
You have to remember how an absorption spectrum is produced. You
need a cooler layer of gas between us and the light source (where the
light comes out) to absorb certain wavelengths. The photosphere is
pretty hot, isn't it? How can there be a cooler layer of gas? As in
many things in astronomy, it's all relative - the layer that is cooler
just has to be slightly cooler than the layer from which the light is
emitted. In this case, the cooler layer has a temperature of about 4800
K, which is about as cool as you'll get in the photosphere. This is
still hot by your standards, but in comparison to the other, deeper
layers in the photosphere, this is cool enough to do the trick - absorb
light and produce an absorption spectrum.
If you were to also look at the spectra given off by other stars, you
would see that about every star (unless there is something seriously
wrong with it) has absorption lines in its spectrum. It is likely that
they also have a slightly lower temperature layer in their atmospheres,
just like the Sun. We'll get back to the photosphere in a bit, but first
we should finish off the other layers of the Sun's atmosphere.
 Figure 4.
Chromosphere of the Sun visible with the SOHO satellite. Notice how the
chromosphere has a rather wispy appearance and is not uniform in shape.
Bright areas indicate the location of solar activity. Image courtesy of
SOHO/EIT consortium. SOHO
is a project of international cooperation between ESA and NASA.
Figure 4.
Chromosphere of the Sun visible with the SOHO satellite. Notice how the
chromosphere has a rather wispy appearance and is not uniform in shape.
Bright areas indicate the location of solar activity. Image courtesy of
SOHO/EIT consortium. SOHO
is a project of international cooperation between ESA and NASA.
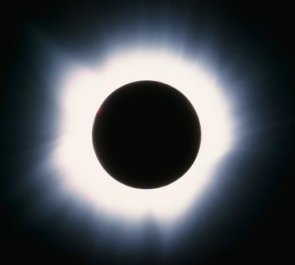 Figure 5. The Corona of the Sun visible during a solar eclipse. Image courtesy of NOAO/AURA/NSF |
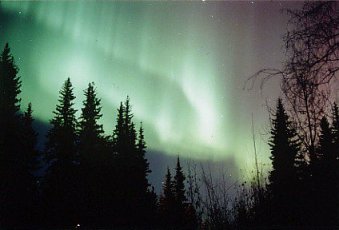 Figure 6. Aurora visible due to the particles ejected from the Sun. Image courtesy of Jan Curtis |
Here's a question - why are the outer layers of the Sun hotter than the photosphere? The atmosphere thins out (gets lower in density) as you get further from the photosphere, so shouldn't that make the temperature go down? This is one of those mysteries about the Sun that was only recently solved. There are mechanisms that pump energy into the upper layers of the Sun, particularly through the interaction of the Sun's magnetic field with these upper layers. We'll get into the magnetic field in just a bit, but you might want to think of the heating up process as kind of an oil gusher of energy from below the surface of the Sun extending all the way to the Corona. The end result is very high temperatures far from the surface of the Sun. The photosphere is the coolest layer of the atmosphere and the corona is the hottest - rather strange, but that's the set up.
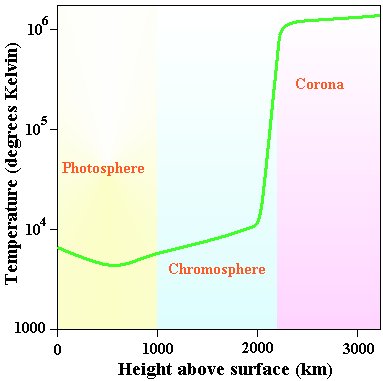 Figure 7.
A graphical representation of the temperature in the various layers of
the Sun's atmosphere. Note how the temperature steadily increases
throughout the chromosphere and peaks in the corona. You can also see
where the temperature is at its lowest point, near 4800 K in the
photosphere.
Figure 7.
A graphical representation of the temperature in the various layers of
the Sun's atmosphere. Note how the temperature steadily increases
throughout the chromosphere and peaks in the corona. You can also see
where the temperature is at its lowest point, near 4800 K in the
photosphere.
The most common type of solar activity is found easily in the photosphere, and these are the things known as sunspots. Sunspots usually come in pairs or groups (they're pretty friendly in that respect). Sunspots actually are rather complex in their structure, usually having two main visible regions; the darker interior is known as the umbra, while the not so dark outer region is known as the penumbra. Yes, these are the same words used in association with eclipses - okay, I'll admit it, astronomers aren't too original in naming things. Any ways, the penumbra has a rather streaky look to it, and may not be as easy to spot (or is that sun'spot'?) as the umbra. Why are they dark? It has to do with temperature. Sunspots are cooler when compared to the surrounding surface of the Sun, with temperatures of around 4200 K being typical. For a high resolution image of a sunspot, click here.
Sunspots are located on the surface (photosphere) of the Sun and can be used to determine the rate at which the Sun rotates. If you were to follow the motion of the sunspots, you would notice that the equator spins around faster than the poles. This is not surprising since the Sun is a big ball of gas, after all, and different parts can move around at different rates. Such motion is known as differential rotation, since different parts rotate around at different rates. It takes about one month for the Sun to rotate around, with the equator taking slightly less time and the polar regions taking slightly more time.
 Figure 8. A large sunspot group is shown, with the main components, umbra and penumbra, indicated. Image courtesy of SOHO/MDI consortium. SOHO is a project of international cooperation between ESA and NASA. |
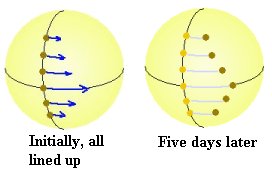 Figure 9. The different latitudes of the Sun rotate around at different rates, so that the equatorial regions get around before the polar regions (since the equator rotates faster). This is the concept of differential rotation. Spots that initially started all lined up will not stay that way very long. |
People wanted to learn as much as possible about sunspots, so they did everything they could to determine what causes them, why they have different sizes and such. Typically sunspots will last for days, weeks, or even months depending upon the size. The bigger ones last longer. One thing that was determined early on was that every 11 years there would be a maximum number of sunspots. This is a pretty regular trend and can be seen in graphs that go back for hundreds of years (since people started to count sunspots after Galileo described them in his observations). A graph showing the average number of spots is shown in Figure 10. Some people think that there is a relation between sunspots and the weather on the Earth, and this is possible. When the sun has a large number of sunspots there are all sorts of other things going on as well (I'll get to that in a minute). The end result is that there is quite a bit of extra energy given off by the Sun when there are a large number of sunspots (this time is called solar maximum). Of course, that energy can come to the Earth and heat up our atmosphere. You can't blame sunspots alone for all the bad weather on the Earth, since our weather is also influenced by many other things, like pollution, volcanic eruptions and such.
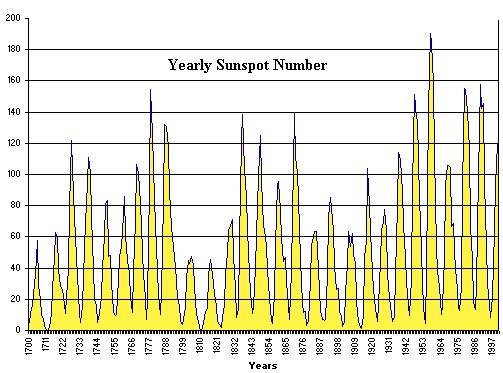 Figure 10.
The number of sunspots varies with a peak occurring every 11 years. This
graph is based on data from the National Geophysical Data Center of
NOAA.
Figure 10.
The number of sunspots varies with a peak occurring every 11 years. This
graph is based on data from the National Geophysical Data Center of
NOAA.
That's one thing we know about sunspots - they have a maximum number popping up every 11 or so years. What else do we know? If you were to obtain a spectrum of a sunspot, you'd see pretty much the same spectrum as you see for the rest of the Sun, but the individual spectral features would be split apart. Instead of seeing a single absorption feature at a certain wavelength, multiple absorption features would be seen. This is what is known as the Zeeman effect and it is caused by strong magnetic fields. This tells us that the areas of sunspots are regions with strong magnetic fields. In fact, in large sunspots it is possible to detect which magnetic polarity they have (north or south). Sunspots are often in pairs or groups, so one part of the group tends to be a south magnetic pole, and the other part is a north magnetic pole. That's pretty cool - but what else can we learn? Take a peak at Figure 11. This shows a magnetic "image" of the Sun with several sunspot groups. Very dark regions are associated with "north" magnetic poles, while the lighter regions are "south" polarity areas.
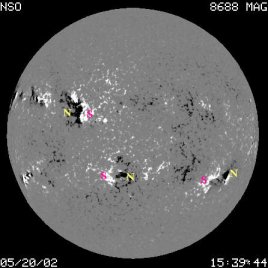 Figure 11. A
magnetic plot of sunspots showing the polarity alignment. Image
courtesy of the National Solar Observatory in Kitt Peak.
Figure 11. A
magnetic plot of sunspots showing the polarity alignment. Image
courtesy of the National Solar Observatory in Kitt Peak.
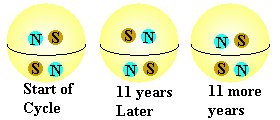
Do you notice how they are arranged in each hemisphere? The spots in the Northern hemisphere are lined up so that the spot with northern polarity is on the left (or west) and the one with southern polarity is on the right (to the east). The spots in the southern hemisphere are just the exact opposite, so that the southern polarity spots are to the west and the northern polarity spots are to the east. Throughout the entire sunspot cycle (which starts when there are the fewest number of spots) this alignment will remain. For 11 years all spots that appear in the northern hemisphere will be arranged with the polarity N-S, while in the southern hemisphere the spots will be ordered S-N. Then when the next cycle starts (after the solar minimum - when fewest spots are seen), the situation is reversed - the spots in the northern hemisphere will be arranged so that their polarity is arranged S-N, while the spots in the southern hemisphere will be arranged N-S. If someone were to ask you how long it takes the Sun to go through a sunspot cycle, the answer wouldn't be 11 years, since after 11 years, the spot polarity isn't where it was at the beginning of the cycle - an entire sunspot cycle takes 22 years - you have to wait for the magnetic polarities to get back in order. Figure 12 shows the cycles.
 Figure
12. The changing polarity of the sunspots. During each cycle, the
polarity of the spots in each hemisphere stays fixed. When the next
cycle starts (11 years later), the polarity is switched. It isn't until
22 years after the first cycle that the Sun is back to where it started
from.
Figure
12. The changing polarity of the sunspots. During each cycle, the
polarity of the spots in each hemisphere stays fixed. When the next
cycle starts (11 years later), the polarity is switched. It isn't until
22 years after the first cycle that the Sun is back to where it started
from.
Somehow the magnetic field of the Sun is involved in sunspots. Another thing that people noticed with the sunspots is where they are seen on the surface of the Sun. When there are very few spots (at sunspot minimum), the spots tend to be seen about 30 or more degrees north and south of the Sun's equator. As the years go by, they start to appear closer to the equator. By the end of the 11 years since they started appearing, they are located very close to the equator. When the spots start appearing far from the equator again, we known that another sunspot cycle is starting. You can check the spots' polarities to be sure - so this is another way of checking sunspot cycle beginnings and endings. A cycle starts with the spots far from the equator and concludes when they are close to the equator. You can have some overlap, but you can distinguish which cycle the spots belong to not only by their location on the Sun, but also their polarity. A map of sunspot locations over the years produces a diagram known as the Maunder Butterfly Diagram. This is shown in Figure 13. You can see that the current cycle started in about 2009 (when there were very few spots). In 2013 the cycle peaked - this would have been the time of solar maximum.
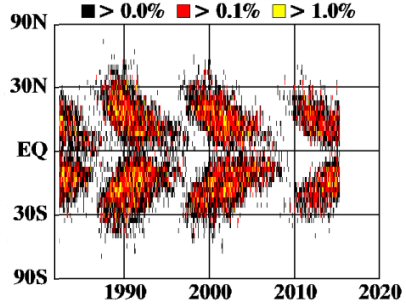 Figure 13. The
Maunder Butterfly Diagram - the locations of the sunspots on the
surface of the sun varies over the 11 year cycle. At the start of a
cycle, the spots are far from the Sun's equator while at the end of the
cycle they are found close to the equator. Image based on data from NASA's Solar
Physics Research Site.
Figure 13. The
Maunder Butterfly Diagram - the locations of the sunspots on the
surface of the sun varies over the 11 year cycle. At the start of a
cycle, the spots are far from the Sun's equator while at the end of the
cycle they are found close to the equator. Image based on data from NASA's Solar
Physics Research Site.
What causes sunspots? We don't know for sure, but we suspect that the differential rotation and convection going on under the photosphere can wrap up and tangle the Sun's magnetic field. As a magnetic field line gets twisted and stretched out by the Sun's wacky rotation, a part of it can erupt near the Sun's surface, producing a sunspot. It is possible this happens when the magnetic field lines get really jumbled up by the differential rotation. The polarities of the sunspots sort of point to this kind of situation, since the magnetic flow continues from one spot to the other - they just sort of pop the magnetic field outside of the Sun for a while. This situation will eventually get worse and worse (more and more spots) until something happens that puts the magnetic fields back in line (untwisted). The only problem is, the magnetic polarity isn't the same as when the stretching originally started - but is reversed, which of course causes the sunspots to have a different order of polarity from the previous cycle. We're not exactly sure how the whole thing works since it is very difficult to compute the behavior of magnetic fields. You might want to think of it as a big rubber band that gets pulled, stretched and then eventually snaps.
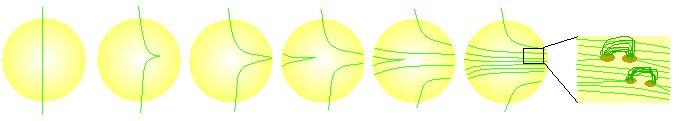
Figure 14. The model for the production of sunspots. The rapid rotation of the sun and the fact that it has differential rotation and bubbling convection cause the magnetic field lines to get wound up and jumbled until they are so distorted that they buckle and break through the surface. How the sun gets back to the original situation is still a mystery. |
When there are many sunspots visible on the surface of the Sun (at the time of solar maximum), other features such as solar flares and prominences are also visible. These are eruptions from the surface, thought to be associated with sunspot activity, but what actually causes them is not completely understood. These eruptions result in the release of large amounts of energy and particles into space. Many of the particles are electrically charged, since the outflow can contain electrons or protons. This flow of particles can cause disruptions of power, communication and some really intense aurorae on the Earth. With the SOHO satellite, astronomers have been able to detect even more energetic eruptions known as Coronal Mass Ejections (CMEs). These blast out excessive amounts of particles and energy at very high speeds (1,500,000 miles/hour). They are mainly associated with the upper layers of the Sun's atmosphere, so they are not always easy to see - at least not with visible light telescopes.
 Figure 15. A large prominence seen on the Sun. The Earth is shown to scale. |
 A rather twisted prominence. Both images courtesy of SOHO/EIT consortium. SOHO is a project of international cooperation between ESA and NASA. |
Observations by the SOHO satellite can alert folks on the Earth when one of these CMEs goes off. We have an advantage, since the particles that cause most of the problem take longer to get here than the light from the event. This is sort of like how you see a firework display before you hear it - it takes time for stuff to get here from the Sun - more than a day, while only a few minutes are needed for the light to get here. This time delay is useful for folks who have to maintain communication satellites, since the particles that come in can disrupt the electronics in satellites. The Earth's magnetic field pretty much protects us from the worst of these blasts, and we can be treated to a really nice display of aurorae. The Space Weather site can provide warnings of such blasts and also predict possible auroral activities.
 |
 |
| Coronal Mass Ejections | |
| Figure 16. The movie above shows multiple CME events. The main part of the Sun is blocked out in the center. The little white circle indicates the actual size of the Sun. The CMEs that are directed towards the Earth cause static like features on the images. The stars in the background are also visible in these images. To the right is a typical large CME. Images and movies courtesy of SOHO/LASCO consortium. SOHO is a project of international cooperation between ESA and NASA |
Less prominent but also visible are the spicules - which extend from the photosphere up through the chromosphere. While the spicules are about 10,000 K, they extend up into hotter layers near the corona (500,000 K) and can appear dark in various filtered views of the Sun. Unlike other events on the Sun, the spicules are very short lived, sort of like goose bumps that come and go on a cold day.
All the major activity events are linked with sunspots - prominences tend to erupt from sunspot groups, CMEs come from sunspot groups, and flares come from the areas of sunspot groups. I am noticing a trend here. When the sun is at solar maximum, there is a greater chance for these things to occur and for there to be effects on the Earth, particularly from the high amounts of charged particles (electrons and protons) that come our way. This would also be the time to watch out for aurorae at lower latitudes, like Iowa. While all of these events do occur at other times, the likelihood of them happening is greater at solar maximum, and the scale of the events are also greater at solar maximum.
Most of the discussion to this point has been about the atmospheric layers of the Sun. While there is a connection between the atmosphere and the interior, it isn't very obvious. How can we learn about the inside of the Sun by studying its exterior? You'll learn a few tricks on how we do this later, but there is a way that we can study the inside of the Sun in a manner similar to the way that geologists study the inside of the Earth without drilling a hole. On the Earth, geologists study how earthquakes travel through the Earth's interior and this provides clues to its internal structure. In a similar manner astronomers can observe how the Sun "vibrates" - yes, that's right; it vibrates sort of like a big bell. This is part of the relatively new field of study known as helioseismology. As the name implies, this is like studying "sunquakes," since seismology is the study of earthquakes. However, it is more complicated than that. Unlike earthquakes, the Sun's vibrations are continuous - they don't stop. If you have ever watched a bell, taunt string or wire make a noise, you see it vibrating quickly. The Sun does a similar thing, except not as fast. It takes about five minutes for one vibration of the Sun. The way something vibrates depends upon the object's structure; astronomers study these vibrations in the Sun to get clues about the interior of the Sun. There are actually several different vibrations occurring in the Sun all at the same time, making it a very complicated thing to work out.
 |
 |
| Figure 17. Above left is a model showing the vibrations of the Sun. One color corresponds to the parts of the Sun that are going inwards, while the other color indicates the parts that are moving outwards. To the right is an animation of how the surface of the Sun moves, though of course the motions are greatly exaggerated and speeded up. Images from the GONG Project. | |