If you click on the graph area, the day and apparent magnitude value for that location are displayed at the top.
The light variation of a Cepheid is shown over the course of many days. Use the sliding scale to change the range of dates that are plotted. When you press "Get New Data", an entirely new star is shown. You can use the "Grid On/Off" button to display values for the magnitude and days. You can also connect the dots by using the "Connect" button. The irregularities in the light variation are due to observational errors.
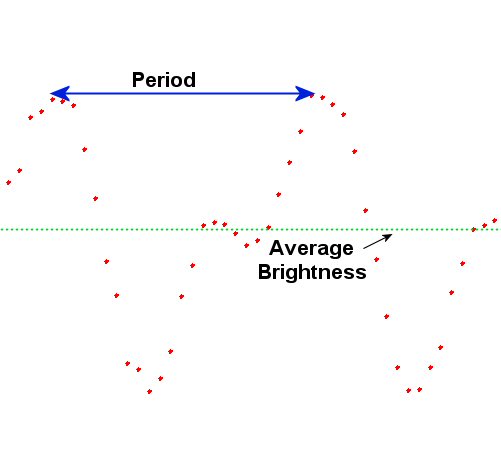
Below is a diagram showing a typical light curve, with the time span for a pulsation period shown and an estimate for the average magnitude.